
Page 63 - Htain Manual
P. 63
Visual Analogue Scale (VAS)
This is the simplest approach to measuring preferences by asking individuals to first
rank health outcomes according to preference in an ascending or descending order, and
second, to place these outcomes on a scale. This is done in such a way that the intervals in-
between the outcomes corresponds to the differences in preference as perceived by the
individual.
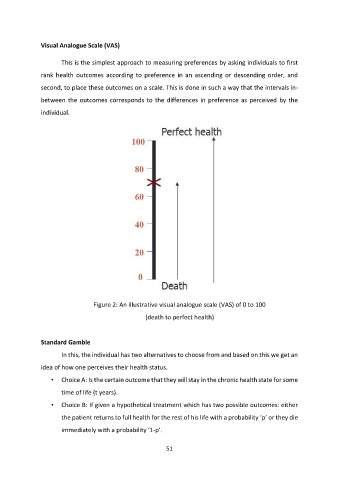
Figure 2: An illustrative visual analogue scale (VAS) of 0 to 100
(death to perfect health)
Standard Gamble
In this, the individual has two alternatives to choose from and based on this we get an
idea of how one perceives their health status.
• Choice A: Is the certain outcome that they will stay in the chronic health state for some
time of life (t years).
• Choice B: If given a hypothetical treatment which has two possible outcomes: either
the patient returns to full health for the rest of his life with a probability ‘p’ or they die
immediately with a probability ‘1-p’.
51