
Page 84 - Htain Manual
P. 84
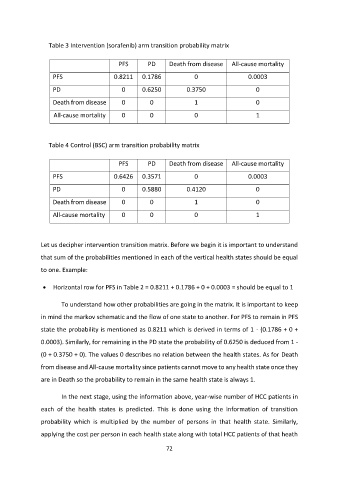
Table 3 Intervention (sorafenib) arm transition probability matrix
PFS PD Death from disease All-cause mortality
PFS 0.8211 0.1786 0 0.0003
PD 0 0.6250 0.3750 0
Death from disease 0 0 1 0
All-cause mortality 0 0 0 1
Table 4 Control (BSC) arm transition probability matrix
PFS PD Death from disease All-cause mortality
PFS 0.6426 0.3571 0 0.0003
PD 0 0.5880 0.4120 0
Death from disease 0 0 1 0
All-cause mortality 0 0 0 1
Let us decipher intervention transition matrix. Before we begin it is important to understand
that sum of the probabilities mentioned in each of the vertical health states should be equal
to one. Example:
Horizontal row for PFS in Table 2 = 0.8211 + 0.1786 + 0 + 0.0003 = should be equal to 1
To understand how other probabilities are going in the matrix. It is important to keep
in mind the markov schematic and the flow of one state to another. For PFS to remain in PFS
state the probability is mentioned as 0.8211 which is derived in terms of 1 - (0.1786 + 0 +
0.0003). Similarly, for remaining in the PD state the probability of 0.6250 is deduced from 1 -
(0 + 0.3750 + 0). The values 0 describes no relation between the health states. As for Death
from disease and All-cause mortality since patients cannot move to any health state once they
are in Death so the probability to remain in the same health state is always 1.
In the next stage, using the information above, year-wise number of HCC patients in
each of the health states is predicted. This is done using the information of transition
probability which is multiplied by the number of persons in that health state. Similarly,
applying the cost per person in each health state along with total HCC patients of that heath
72